Wave Rectangle Infographic: A Design Evaluation
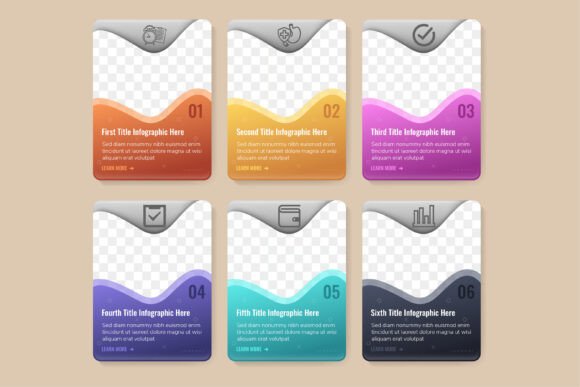
In the landscape of digital communication, visual clarity is paramount. The Wave Rectangle Infographic represents a specific category of design assets tailored for professionals seeking to present data or concepts with modern aesthetics. This resource consists of six separate rectangular elements, often referred to as cards, which feature colorful gradient wave-like details, thin line icons, and dedicated text boxes. Understanding the utility, technical specifications, and appropriate application of this template is essential for designers, marketers, and business analysts evaluating their visual toolkit.
Defining the Wave Rectangle Infographic Structure
The core structure of the Wave Rectangle Infographic relies on a modular layout. It provides six distinct vertical or horizontal rectangles that function as independent units within a cohesive system. Each card integrates a background element characterized by fluid, multicolored gradients resembling waves, contrasting with clean, thin-line pictograms. Inside these frames are designated areas for text, allowing for concise descriptions, feature lists, or statistical highlights.
This design approach merges the stability of rectangular layouts with the dynamic movement of organic shapes. The use of vector illustration ensures that every element, from the gradient curves to the icon lines, remains crisp at any scale. Because the file includes formats such as AI (Adobe Illustrator), EPS, SVG, and high-resolution JPG, it is built for versatility across both print and digital media environments. The editable nature of the text, shapes, and colors allows users to customize the asset without compromising its structural integrity.
Reasons to Consider This Design Asset
Professionals might be interested in the Wave Rectangle Infographic for several practical reasons. First, the modular six-card format aligns well with common content structures, such as listing key features, outlining process steps, or comparing options. In a business presentation, having a pre-designed set of cards can significantly reduce the time spent on layout creation.
Second, the aesthetic appeal of the gradient wave details offers a contemporary look that stands out against more traditional, flat designs. For industries like technology, creative agencies, or modern startups, this visual style communicates innovation and energy. The inclusion of thin line icons further enhances readability, providing visual anchors that guide the viewer's eye through the information without overwhelming them.
Additionally, the technical specifications address a common pain point in design workflows: resolution. With graphics provided in 300dpi and fully vectorized, the asset eliminates the risk of pixelation when printed on large banners or brochures. This makes it a reliable choice for projects requiring high-quality physical outputs alongside digital web integration.
Benefits and Practical Advantages
Adopting the Wave Rectangle Infographic offers tangible benefits for project efficiency and visual consistency. The primary advantage lies in its editability. Since the text, shapes, and colors are fully adjustable, users can adapt the template to match specific brand guidelines instantly. This flexibility is crucial for maintaining brand identity while leveraging a professional design foundation.
The organization of the file also contributes to workflow speed. A well-organized layer structure means that designers can locate specific elements—such as the gradient paths or icon sets—without navigating through cluttered files. This reduces the learning curve and accelerates the production timeline.
Furthermore, the availability of multiple file formats (AI, EPS, JPG, SVG) ensures compatibility with various software ecosystems. Whether a team uses Adobe Creative Cloud, CorelDRAW, or needs an image for a web CMS, the provided formats cover most standard requirements. The SVG format, in particular, is ideal for responsive web design, ensuring the infographic scales perfectly on mobile devices.
Tradeoffs and Considerations
While the Wave Rectangle Infographic offers significant advantages, there are tradeoffs to consider. The primary limitation is the fixed number of elements. The template provides exactly six cards. If a project requires presenting seven, eight, or ten points, the user must either duplicate and modify the existing cards or source additional assets to maintain visual consistency. While duplication is possible, it may require manual adjustment to ensure spacing and alignment remain balanced.
Another consideration is the stylistic fit. The colorful gradient wave aesthetic is distinctly modern and vibrant. This style may not align with brands that prioritize minimalism, monochromatic palettes, or conservative corporate identities. In such cases, the "multicolored" aspect of the design could clash with the intended tone, requiring extensive recoloring or modification of the gradient elements to achieve a neutral look.
Additionally, reliance on pre-made templates can sometimes lead to a generic appearance if too many competitors use similar resources. To mitigate this, users should invest time in customizing the icons, typography, and color schemes to create a unique variation that distinguishes their work.
Ideal Situations for Application
The Wave Rectangle Infographic is a strong fit for specific scenarios where structured information needs to be presented engagingly. It excels in:
- Feature Lists: Showcasing six key benefits of a product or service on a landing page or sales brochure.
- Process Explanations: Breaking down a six-step workflow or methodology in a training manual or website section.
- Comparative Analysis: Displaying six different options, plans, or categories side-by-side for easy comparison.
- Presentation Slides: Creating visually consistent slides for investor pitches or internal reports where data visualization is required.
- Web Banners: Using the individual cards as standalone banners for social media or website headers.
In these contexts, the combination of text boxes and icons facilitates quick scanning, which is essential for audiences consuming information rapidly online.
When to Consider Alternatives
There are situations where the Wave Rectangle Infographic may not be the optimal choice. If the content volume exceeds six distinct points, a continuous flow chart, a circular diagram, or a grid-based layout with variable numbers of cells might be more effective. Similarly, if the data involves complex relationships, timelines, or hierarchical structures, a simple list of cards may fail to convey the necessary nuance.
For projects requiring strict adherence to a black-and-white or grayscale palette, the effort required to strip away the gradient details might outweigh the benefit of using the template. In such cases, a minimalist line-art template without color fills would be more efficient. Furthermore, if the target audience prefers dense textual information over visual segmentation, a traditional report format or a long-form article layout might serve better than a segmented infographic.
Decision-Making Insights
When deciding whether to utilize the Wave Rectangle Infographic, evaluate your project against three criteria: content count, brand alignment, and output medium. If you have approximately six key messages, a need for a modern visual style, and a requirement for high-resolution output across print and web, this template aligns well with your goals.
However, if your content is fluid in number, your brand guidelines are strictly monochromatic, or your message requires complex data mapping, exploring alternative infographic styles is advisable. Ultimately, the value of this resource lies in its ability to provide a polished, editable foundation that saves time while offering enough flexibility for customization. By understanding its strengths and limitations, you can make an informed decision that enhances the clarity and impact of your communication.